

I’d show the next day, but it’s almost the same.
I’d show the next day, but it’s almost the same.
Syslog
Local logging is covered in Part I, but a device can only hold a certain amount of data. Centralized logging for easier access, correlation and historical tracking is something a good network needs.
Configuring remote syslog is a fairly easy process:
Switch(config)#logging host <ip-address>
That’s it. Of course, many extra options are possible:
As a syslog server, many free and commercial ones are available. For a simple lab or home setup, I’m using tftpd32 (and tftpd64 for 64-bits systems). A very useful tool, and the TFTP function can also be used to upload IOS files to Cisco devices.

Log optimization
Great, now logging works, but what further tweaks can be added? Quite a few, but I’m just going to describe the three things I find most useful.
First, it’s possible to log commands configured in the switch using the following configuration:
Switch(config)#archive
Switch(config-archive)#log config
Switch(config-archive-log-cfg)#logging enable
Switch(config-archive-log-cfg)#hidekeys
Switch(config-archive-log-cfg)#notify syslog contenttype plaintext
Switch(config-archive-log-cfg)#end
From now on, logging shows which user typed which command. Useful for an audit trail and seeing what went wrong during configuration.
Second, a link up/down event generates a severity 3 log message, but not every interface is equally important, and in an office environment a lot of these events may be generated during the day. This can be changed on a per-interface basis:
Switch(config-if)#logging event link-status
It’s also possible to toggle STP, PoE and DTP events. By default, they are all active, but ‘no’ in front of the command disables it. This way, logging and alerting of just the important ports becomes possible.
And last: when logged in through the console at a default speed of 9600 bps, it’s possible to become overwhelmed by the many logging messages. It can be rate-limited, with exceptions for certain severity levels, e.g.:
Switch(config)#logging rate-limit console 3 except 1
This logs a maximum of three messages per second towards the console, with exception of severity 1 alerts and up, who will always show.
When I was studying for CCNA and even CCNP, I never gave that much attention to logging features on a device. Although I got through the certifications without it, I realize now that without proper logging, troubleshooting complex issues after they happen is just plain impossible. Logging is mandatory, otherwise you might very well end up with a network that goes down at seemingly random intervals, unable to figure out what is causing it.
Logging
Some basics first: for logging, there are 8 different levels of events, to differentiate between different severity levels (RFC 5424 for details). These are the levels:
I’ve never seen a level 0 event in logging, as ‘the system is unusable’ in reality means the device has crashed. Below some example logs:
Dec 16 16:05:18.438: %SSH-5-ENABLED: SSH 2.0 has been enabled
Dec 16 17:38:50.518: %LINK-3-UPDOWN: Interface FastEthernet0/2, changed state to up
Dec 16 17:41:11.725; %SYS-6-CLOCKUPDATE: System clock has been updated
First the notice that SSH 2.0 has been enabled, followed by ‘error’ level of a link state change and an informational message that the system time has been updated. Note that these messages have a timestamp: for proper logging, the device clock needs to be accurate. Be sure to look into the possibilities of NTP.
When you’re connected by console, you can see the logging messages in real-time. By default, through Telnet or SSH, you don’t. The command ‘terminal monitor’ enables this behavior. Next to this, there’s also the possibility to choose the logging level: ‘logging console 0-7‘ for the console and ‘logging monitor 0-7‘ for Telnet and SSH. So ‘logging console 3’ will only show level 3 events and up: link state changes, security issues (usually level 2, e.g. port-security),… but no clock updates.
But this is only real-time monitoring. To have some history, switches have a local log buffer: ‘logging buffered size 0-7‘, where size is the size of the log buffer in bytes. The bigger, the more history, but also the more RAM usage, so think before typing huge numbers. If configured, ‘show logging’ shows you the different logging levels configured, followed by the contents of the log buffer. Filtering can be useful here, e.g. ‘show logging | include 0/2’ to show all events related to interfaces with 0/2 in the name.
Now we’re getting somewhere: logs, present on the device, with timestamps. Enough to SSH to a device after a mayor event in the network and see what happened. But what if the device reboots? Everything is stored in RAM. For this there’s two options: syslogging to a remote server, and storing messages on the flash. Syslogging will be discussed in part II, but it’s not fool-proof since syslog uses UDP (port 514) and during mayor network events, those UDP packets may get lost. Storing logging on flash can be done with ‘logging file flash:log.txt size 0-7‘, where ‘log.txt’ is a file name, size is the maximum size on flash (be careful to leave room for other critical files such as IOS and startup-config) and again followed by a severity level. Because it is flash, it’s best not to overuse it and set the level to error (3) or critical (2). The file can be seen with ‘more log.txt‘, even after a reboot. Useful to recover some data from a crashed device.
Utilization
Logs are one thing, but some things aren’t visible in logs. Most important one is CPU utilization: if something is clogging the CPU (e.g. a broadcast storm), there may not be any logging events, and even if there are, they may not point in the right direction, such as spanning-tree topology changes, giving the impression a link went down somewhere while it’s not the case. Three great commands:
The following configuration is something I wouldn’t recommend, but can be useful on a single switch (SOHO environment) without dedicated logging infrastructure: interface utilization graphs on the switch. There can be enabled with the ‘history bps’ (bytes per second) or ‘history pps’ (packets per second) command under interface configuration mode. After enabling, you can see an ASCII graph of the interface with ‘show interface interface history’:
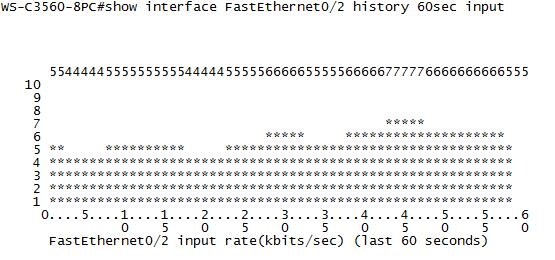
This is just a 60 second graph, but just like with CPU utilization, it can show up to three days.
Security today. I’ve done some testing with a honey pot. What is a honey pot? It’s a (network) construction you make to lure in hack attempts and/or malware. You can use it for early detection of threats, analysing attacker behaviour, or drawing away attention from the real target.
There are several ways to set up a honey pot, depending on what you want. Inside an enterprise, you can set up a server that acts just like a real production device, but it’s not providing any real services and instead is logging every attack against it. Allocating an empty subnet, then logging everything that enters that subnet is also a good method: an empty subnet is supposed to be untouched, so anything entering it may be scanning for targets.
My method is similar to the ones above, except I don’t have a free subnet to allocate. But the NAT router I have has a DMZ option. In practice this does the following: any port or protocol that’s not in use by another device on the private subnet, will be forwarded to the IP defined in DMZ. Example: PC 2 is set in DMZ, internal IP 192.168.168.2. All other PCs use the NAT router to access internet. This means that if PC 2 makes a connection to a web server, source port 33502, destination port 80, the web server will reply from port 80 to port 33502 again. The NAT router then forwards port 33502 to PC 2 because it was opened by PC 2. But if something enters on port 33503 and that port has not been opened by an inside device, it will be forwarded to PC 1, who will then log it.

For logging I used a Windows XP with Wireshark. The Windows XP had static IP 192.168.168.2, correct subnetmask, but no gateway. Why? Because I want to do passive logging and the logging device should be unable to respond back, especially since it had no firewall and received everything unfiltered. On Wireshark I set up a filter to only capture unicast packets to its own static IP, filtering away background noise. The only problem is that my ISP blocks off any incoming port below 1024, meaning I will not see any connection attempts on most well-known ports, so I had no big expectations.
I kept it running all night, a total of 14 hours and 30 minutes. And the next day, Wireshark indeed reported several captured packets. Here’s what I found:
That’s 4 packets over 14 hours which are used to scan for weaknesses: 3 ping, 1 SQL. Not taking into account anything below 1024. Not much, but enough to prove the necessity for firewalling.
Extra information: to look up the geographical location of each IP, I used http://www.ipligence.com/geolocation
I’ve recently started to implement NTP services on my network, and in my lab. NTP stands for Network Time Protocol, and is used in a network to synchronize the clock between all devices in use. It’s mandatory for good logging. I’ve set up a simple free syslog server on my computer, but without NTP, clock settings are lost each time a device restarts. So after starting up my lab devices one at a time and doing tests, I get weird results on syslog, e.g. a ping was sent at 00:18:23 on device A and received on device B at 00:06:49. You can’t properly test stuff if your clocks are suggesting time travel is possible.
Hence NTP. Setting it up to receive the correct time is fairly easy: first find an NTP source server. You can find a list of stratum 1 servers on the ntp.org site. NTP servers use a hierarchy of strata, where zero means the highest source. A stratum 0 server is often an atomic clock. Stratum 1 servers update from stratum 0 servers, stratum 2 from stratum 1, and so on. NTP supports up to 256 strata according to wikipedia, but most devices I’ve worked with only go up to strata 16. It’s obvious that the lower the strata, the more precise the time will be, so I don’t see the point beyond 16 either.
NTP is supposed to synchronize time in the microsecond range, so it’s accurately enough for my lab tests, and even most company logging systems. It runs on UDP port 123, on top of IP. For IP-less connections, you can use Precision Time Protocol, which runs directly on layer 2, but it’s mostly supported on Unix systems only. You can find a deamon for it here.
Making devices update with the NTP server is simple. In Windows there’s a tab in the time settings for it. A similar situation in most GUI Linux distro’s and Mac OSX. In the IP Phone there’s an option for it in the settings menu. In Cisco devices, it’s ‘ntp server <ip>’, in Vyatta ‘set system ntp server <ip>’. Since NTP servers always give UTC time, you will also have to configure the time zone: ‘clock timezone <num>’ in Cisco, ‘set system time-zone <num>’ in Vyatta. Cisco asks for a timezone referenced to GMT (e.g. +1), Vyatta for an absolute timezone (e.g. 2 for Western Europe).
That synchronizes all devices. For end devices, especially IP Phones, you can make this task easier by using DHCP to include the NTP server in it’s messages. DHCP supports a number of options which you can add to the DHCP server configuration, for various services. NTP is option 42. After adding the command ‘option 42 ip ip-address‘ to my Cisco router’s DHCP config, my IP Phones automatically receive this information and start synchronizing time. Windows Server has a similar option.
That’s one solution to the problem, but according to the rules of engagement of ntp.org, it’s best that I contact the stratum 1 NTP server as few as possible to decrease the load. I understand that, and I’d like to set up an NTP server internally, acting as a stratum 2 NTP source. You can do this on Windows Server, but the method is quite elaborate. On a Cisco router, the command is ‘ntp master 2’, where 2 is the stratum number. On Vyatta, it is even easier: since version 6 it is on by default after configuring the NTP client. Older versions of Vyatta don’t support it.
Now I have one server contacting the external stratum 1 source, which in turn distributes the information to all my other devices. Simple and efficient.
Yesterday my internet connection went down, which has been happening often lately. Wanting to make sure it wasn’t the fault of any configuration on my side, I did several pingtests and concluded everything was fine up to the ISP gateway router I have, but no connection beyond that. I called the ISP, who informed me that they saw some disconnects but too little to make a case. I was asked to note down the time when a failure occurred, do this for a time period, and let them know if the situation became worse.
I suppose most of the readers have had a similar experience with an ISP once. I can’t blame them that they need more data but I would like a more stable connection. And I’m not home all the time to check the connection. But, with a Cisco 3560 switch running 24/7 in the network, I have a dedicated device to track the internet connection status. For this, I will be using IP SLA. You can find a detailed guide of it on the Cisco website.
For a more detailed view of what is failing, I will be tracking two objects: an ICMP ping to the ISP gateway router at 192.168.0.1, and a DNS query to the ISP DNS server. This way I can tell whether the ISP device or the connection is failing. I opted for a DNS query because sometimes pings still work while websites don’t (I’m not sure why, perhaps related to the small MTU). But before configuring this, I’m going to set the time on my switch, because otherwise all logged failures are useless.
The time can be set locally using the ‘clock set’ command, but it would not be entirely accurate and time would be lost after a switch reboot, so NTP is a better option. After finding a regional NTP server, I configure the commands:
Switch(config)#clock timezone CET -1
Switch(config)#clock summer-time CDT recurring
Switch(config)#ntp server 193.190.230.66
The timezone (Central European Time) is needed because a NTP uses Coordinated Universal Time (UTC). Cisco IOS supports summer-time, so I add that too. A ‘show clock’ reveals the correct time. Now to the configuration of the IP SLA:
Switch(config)#ip sla 20
Switch(config-ip-sla)#icmp-echo IP
Switch(config-ip-sla-echo)#frequency 60
Switch(config-ip-sla-echo)#timeout 100
Switch(config-ip-sla-echo)#exit
Switch(config)#ip sla 30
Switch(config-ip-sla)#dns google.com name-server 8.8.8.8
Switch(config-ip-sla-echo)#frequency 60
Switch(config-ip-sla-echo)#timeout 500
I used my ISP’s DNS, the one used here is Google’s. Frequency is set to 60 seconds, and time-out in milliseconds is added, so the IP SLA can be triggered by a slow connection too. This is the correct configuration but it still needs to be activated to work. Since I want it running all the time, I make it forever:
Switch(config)#ip sla schedule 20 start-time now life forever
Switch(config)#ip sla schedule 30 start-time now life forever
Once it is running, you can check the IP SLA state with ‘show ip sla statistics’. Normally one would set up a SNMP client that will monitor the state of IP SLA and gather alerts, but because that requires a computer to be powered on all the time, I’m going to bind it to the local syslog. Keep in mind that this is not a good practice on a production switch: there’s only a small logging buffer present and information is lost on reboot. To do this, I use a hidden command, not visible with ‘?’:
Switch(config)#track 2 rtr 20
Switch(config-track)#end
Switch(config)#track 3 rtr 30
Switch(config-track)#end
The ‘rtr’ part makes the IP SLA a tracked object. This generates a notification (severity 5 syslog trap) every time an IP SLA changes state. Using the ‘show logging | include TRACK’ command you can see when failures occurred. And now, we wait.
Update September 25, 2011: I didn’t have to wait long, I had a random disconnect yesterday, triggering the DNS check IP SLA. The ping to the modem didn’t fail, so the modem has had no downtime so far.

