
When I was studying for CCNA and even CCNP, I never gave that much attention to logging features on a device. Although I got through the certifications without it, I realize now that without proper logging, troubleshooting complex issues after they happen is just plain impossible. Logging is mandatory, otherwise you might very well end up with a network that goes down at seemingly random intervals, unable to figure out what is causing it.
Logging
Some basics first: for logging, there are 8 different levels of events, to differentiate between different severity levels (RFC 5424 for details). These are the levels:
- 0 Emergency: system is unusable
- 1 Alert: action must be taken immediately
- 2 Critical: critical conditions
- 3 Error: error conditions
- 4 Warning: warning conditions
- 5 Notice: normal but significant condition
- 6 Informational: informational messages
- 7 Debug: debug-level messages
I’ve never seen a level 0 event in logging, as ‘the system is unusable’ in reality means the device has crashed. Below some example logs:
Dec 16 16:05:18.438: %SSH-5-ENABLED: SSH 2.0 has been enabled
Dec 16 17:38:50.518: %LINK-3-UPDOWN: Interface FastEthernet0/2, changed state to up
Dec 16 17:41:11.725; %SYS-6-CLOCKUPDATE: System clock has been updated
First the notice that SSH 2.0 has been enabled, followed by ‘error’ level of a link state change and an informational message that the system time has been updated. Note that these messages have a timestamp: for proper logging, the device clock needs to be accurate. Be sure to look into the possibilities of NTP.
When you’re connected by console, you can see the logging messages in real-time. By default, through Telnet or SSH, you don’t. The command ‘terminal monitor’ enables this behavior. Next to this, there’s also the possibility to choose the logging level: ‘logging console 0-7‘ for the console and ‘logging monitor 0-7‘ for Telnet and SSH. So ‘logging console 3’ will only show level 3 events and up: link state changes, security issues (usually level 2, e.g. port-security),… but no clock updates.
But this is only real-time monitoring. To have some history, switches have a local log buffer: ‘logging buffered size 0-7‘, where size is the size of the log buffer in bytes. The bigger, the more history, but also the more RAM usage, so think before typing huge numbers. If configured, ‘show logging’ shows you the different logging levels configured, followed by the contents of the log buffer. Filtering can be useful here, e.g. ‘show logging | include 0/2’ to show all events related to interfaces with 0/2 in the name.
Now we’re getting somewhere: logs, present on the device, with timestamps. Enough to SSH to a device after a mayor event in the network and see what happened. But what if the device reboots? Everything is stored in RAM. For this there’s two options: syslogging to a remote server, and storing messages on the flash. Syslogging will be discussed in part II, but it’s not fool-proof since syslog uses UDP (port 514) and during mayor network events, those UDP packets may get lost. Storing logging on flash can be done with ‘logging file flash:log.txt size 0-7‘, where ‘log.txt’ is a file name, size is the maximum size on flash (be careful to leave room for other critical files such as IOS and startup-config) and again followed by a severity level. Because it is flash, it’s best not to overuse it and set the level to error (3) or critical (2). The file can be seen with ‘more log.txt‘, even after a reboot. Useful to recover some data from a crashed device.
Utilization
Logs are one thing, but some things aren’t visible in logs. Most important one is CPU utilization: if something is clogging the CPU (e.g. a broadcast storm), there may not be any logging events, and even if there are, they may not point in the right direction, such as spanning-tree topology changes, giving the impression a link went down somewhere while it’s not the case. Three great commands:
- show proc cpu sorted: show which process is taking most CPU.
- show proc cpu | include CPU: quickly shows CPU usage. You can repeat this command quickly a few times, even when the device is under load, due to the single line of output.
- show proc cpu history: draws an ASCII graph of CPU usage. Less relevant than the other too, but admit it: a lot cooler.
The following configuration is something I wouldn’t recommend, but can be useful on a single switch (SOHO environment) without dedicated logging infrastructure: interface utilization graphs on the switch. There can be enabled with the ‘history bps’ (bytes per second) or ‘history pps’ (packets per second) command under interface configuration mode. After enabling, you can see an ASCII graph of the interface with ‘show interface interface history’:
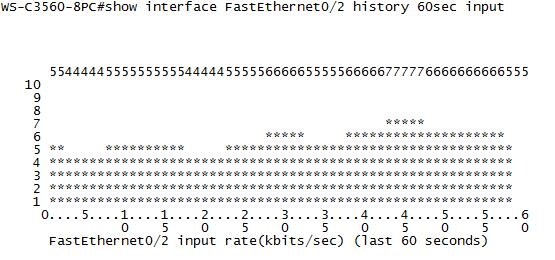
This is just a 60 second graph, but just like with CPU utilization, it can show up to three days.
